Data
"Sleep is an investment in the energy you need to be effective tomorrow"
Introduction
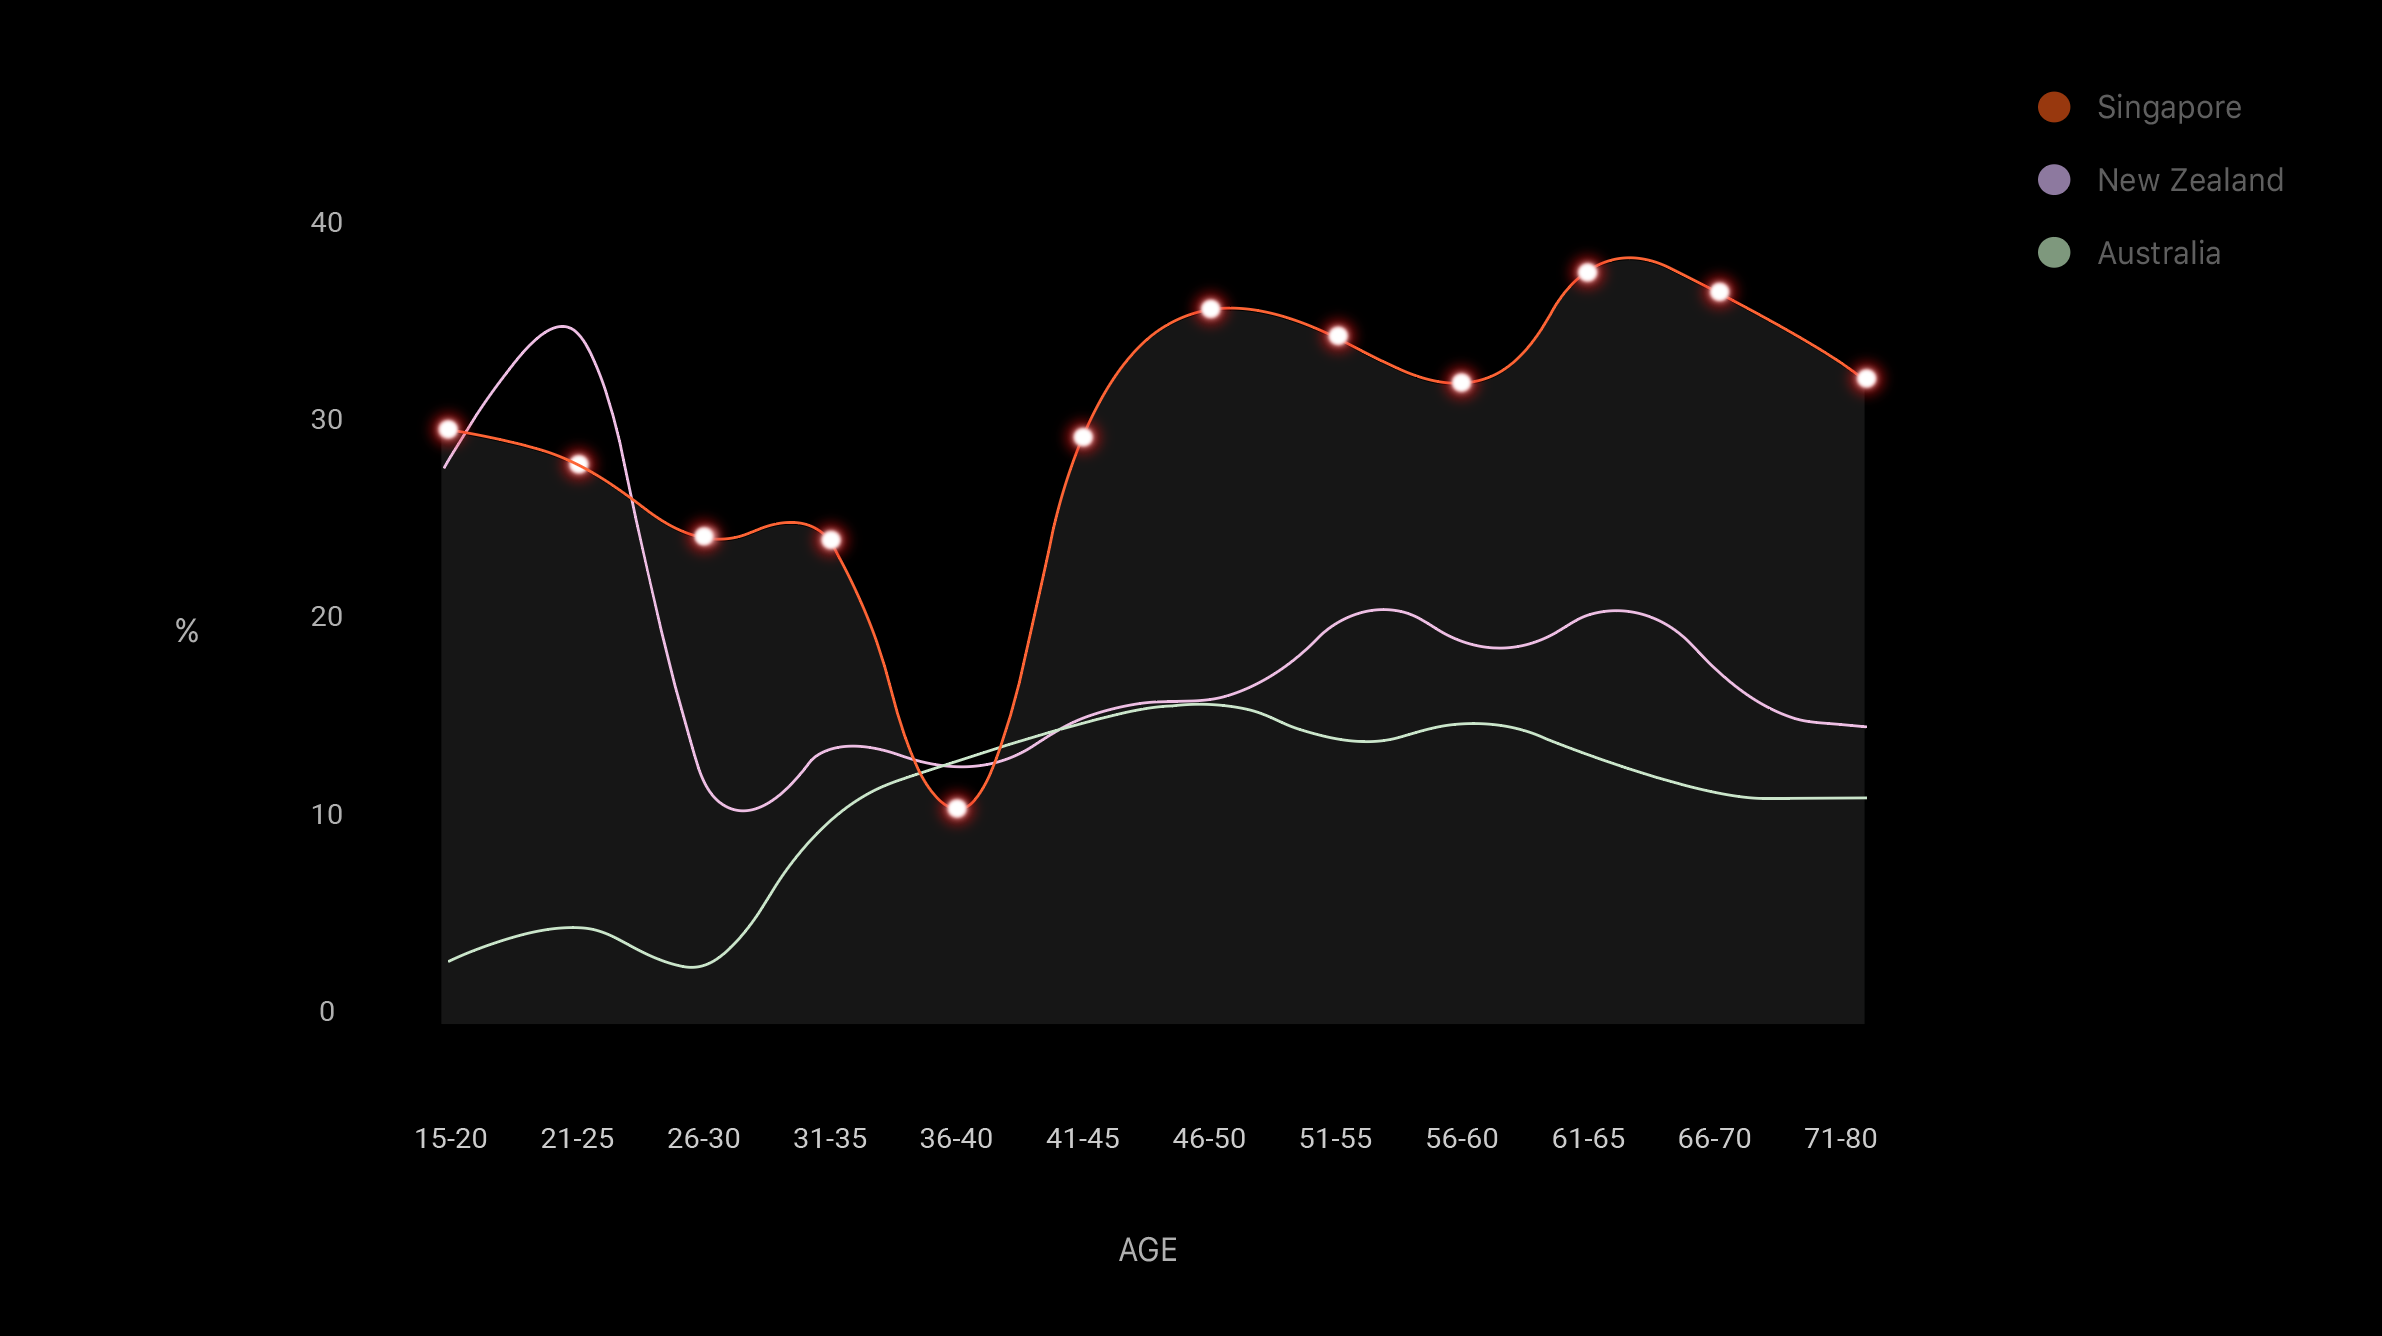
Along with the rising concerns and interests of sleep, Singapore is known as one of the most sleep deprived countries around the world and my datasets are analyzing this phenomenon. I’ve attempted to gather a wide variety of datas across the subject, starting from sleeping status by age, compared with two other countries, Australia and New Zealand, which are known as the least sleep deprived countries.
Data Visualisation
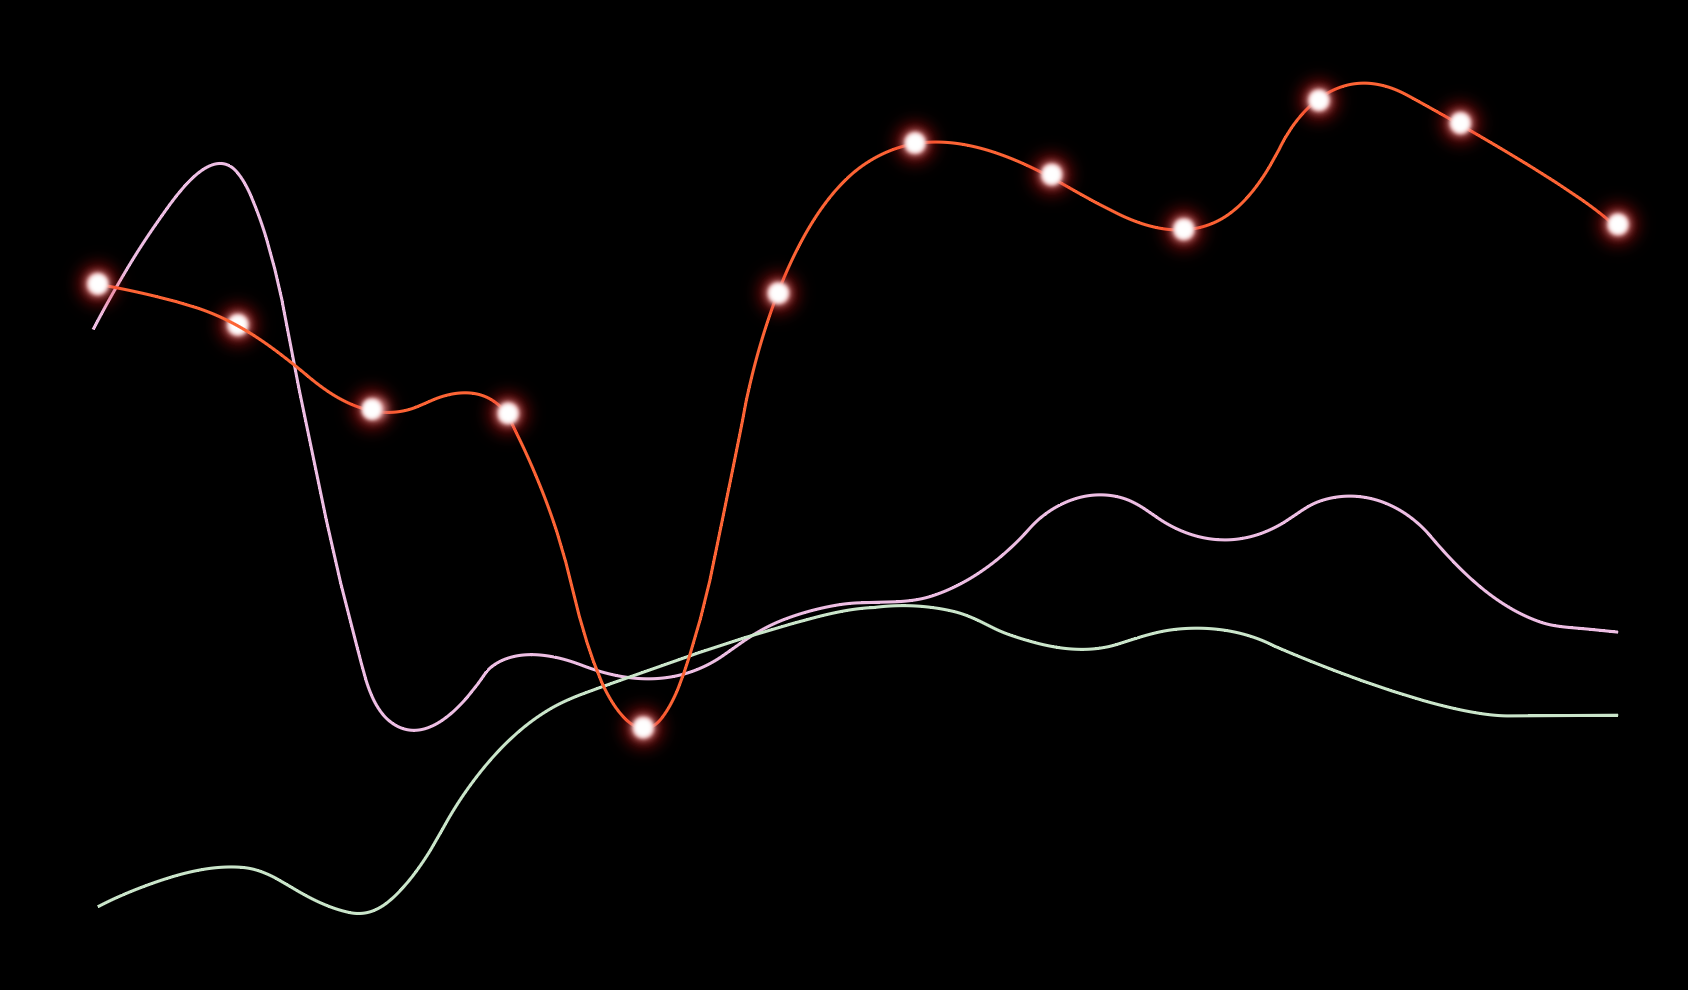
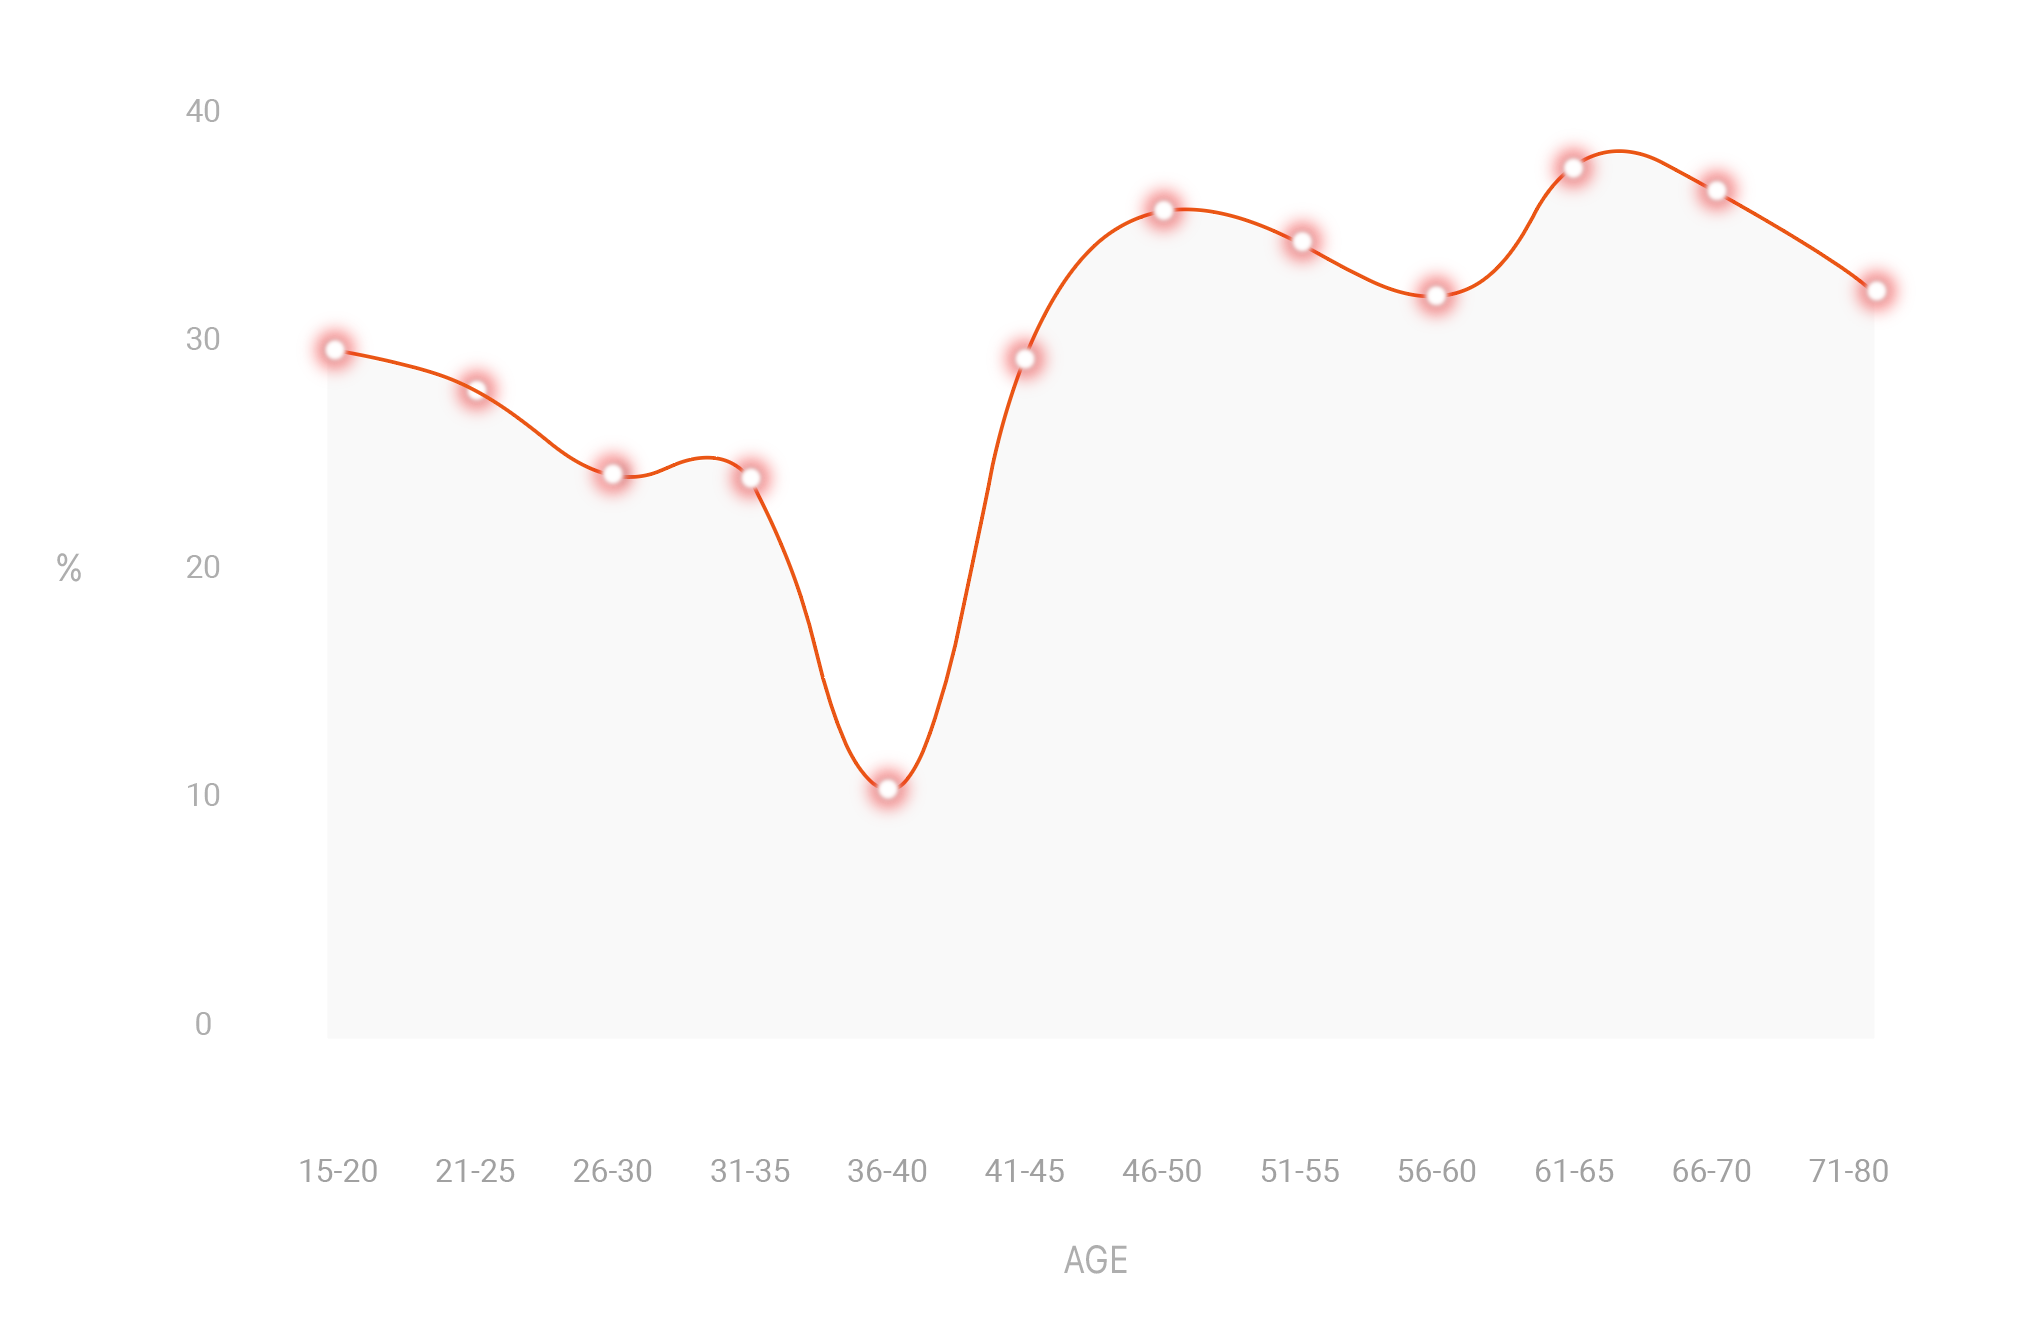
I needed my graph to display the difference in data clearly as well as showing comparison between other variables too. To achieve this, I’ve chosen a simple line graph. Within the line graph there were some tryouts which I’ve started with showing each sleeping time variable using the whole line. So it was 5 lines describing the sleeping status for 12 groups of ages. However it turned out to be not achieving my goal ‘Clarity’ since I had to add one more variant which was ‘World-wide sleeping durations recommendation’. So I’ve thought of a more effective way to present and what I’ve come up with was instead of adding another line to compare my dataset, I’ve figured out the percentage of sleep deprivation according to the recommended sleeping duration and finalized it into a dataset. Using this way, my line graph turned out to be in a much readable form.
Findings
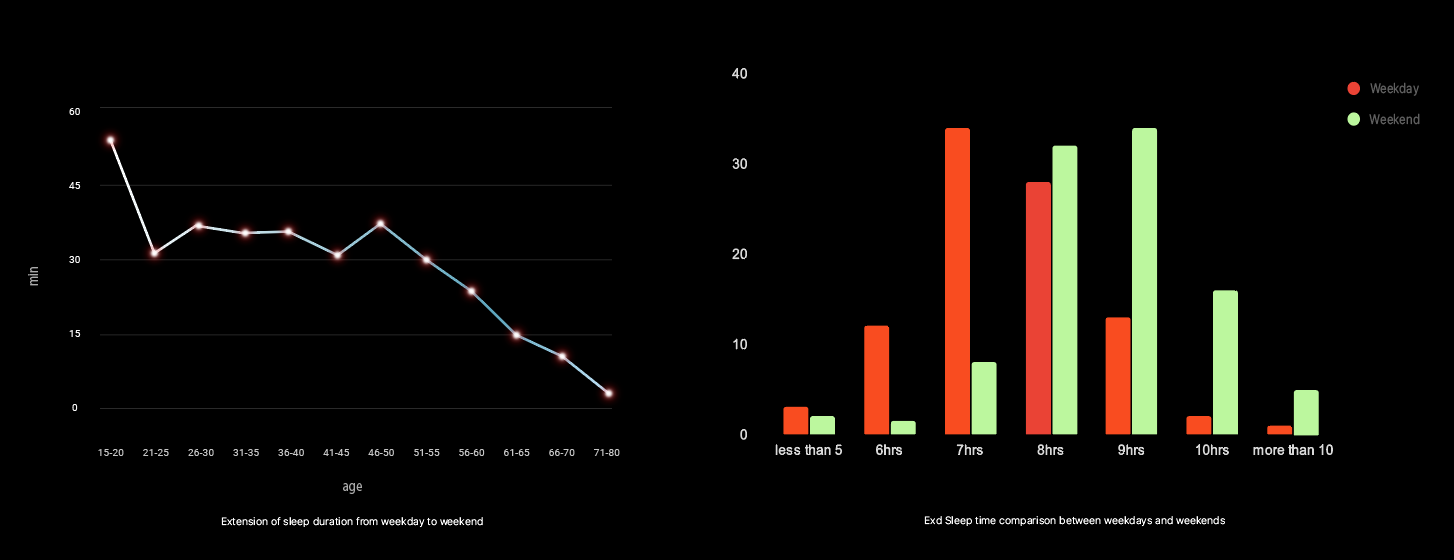
From the age I’ve covered, the graph depicts that more than half of the age groups reached above 30% of sleep deprivation. From age 15 to 50, it shows a falling trend which indicates the people tend to get more sleep as they age until 40. From then on, elderly population starting from age 41, had a general high numerical value reaching a peak in age 61-65 almost at 40%. Compared to Australia and New Zealand, as well as the general ratio of deprivation in high status, people aged above 40 start to show more significant differences. Further on I’ve gathered data of people sleeping time on weekdays and weekends and I’ve visualized this data using a bar graph. Sleeping duration on weekdays, the order of duration hour ratio were from 7hours ( 34%) - 8hours ( 28%) - 9hours ( 13%). 15% of the population slept less than 6 hours and 3% of them slept more than 10 hours. On the contrary, for weekends the value ranked from 9hours ( 34%) - 8hours ( 32%) - 10hours ( 16%). Less than 4% of people slept less than 6hours on weekends and 21% of them slept more than 10 hours.
Lastly, the difference of hours in comparison between weekdays and weekends by age has shown that the difference between them peaked from the age 15-20 group for an average 55 minutes and constantly dropped and reached its lowest point at the age 71-80 group with an average of 3 minutes.
Insights
Normal health conditioned adults and older adults are recommended to sleep 7 to 9 hours but more than 30% of the relevant populations weren’t following this demand especially for elderlies. Especially for ones above 40, there were notable differences between two other countries which shows they are objectively short of sleep. What I expected was that the younger generation would have more lack of sleep but turned out to be the opposite according to the research.
People have slept clearly more on weekdays according to the comparison between them, and the fact that 16% of people slept for more than 10 hours and only for 3% for weekends shows that they tend to catch up on sleep on weekends. However, according to the time difference for weekdays and weekends sleep duration data, the elderly groups aren’t contributing to the result, in contrast to younger groups. So the result can be interpreted as those under 50 tend to sleep less on weekdays and supplement the lack of sleep on weekends.
Conclusion
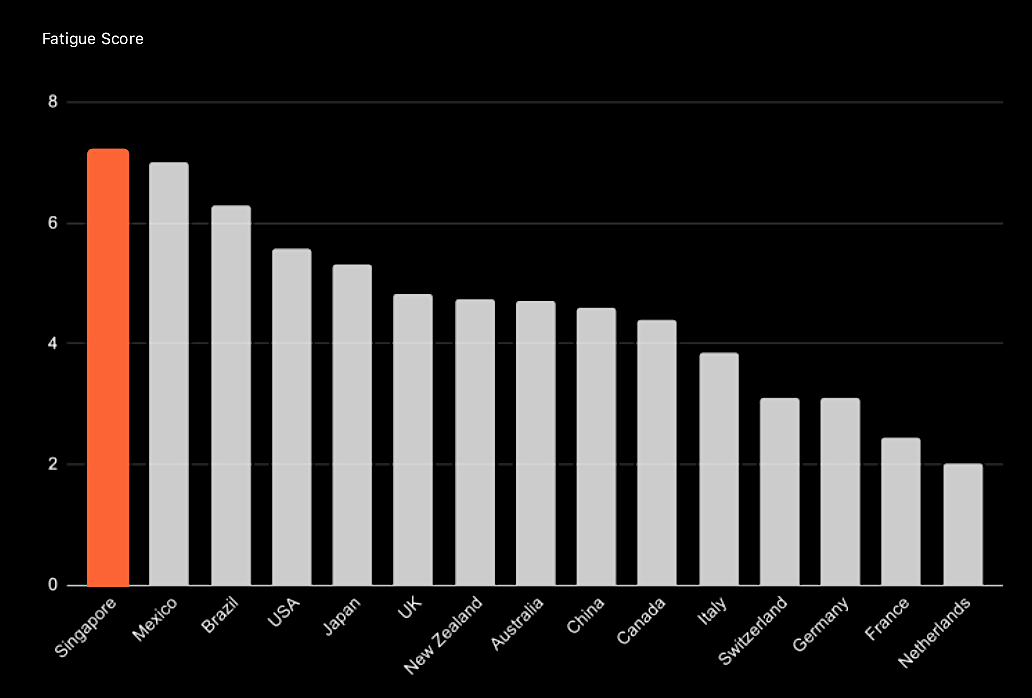
Based on the findings, we get to understand the general sleeping status for Singaporeans, and with it it’s probably reasonable to expect that even though quite a ratio of Singaporeans are sleep deprived,for weekends they are supplementing it so the fatigue of the week might be resolved. However Singapore was ranked one of the most fatigued countries with the fatigue score of 7.2. This indicates that no matter how much they sleep on weekends, they are still sleep deprived and fatigued. Since the data has turned out like this, I can assume one more thing that the result is due to the workload of weekdays and people might be concerned about a break away from it. However, I've found research where they’ve gone over 18 countries over the world and gathered how many percent of people want to work until they die and Singapore has ranked 3rd along with Canada and India. Apart from the fatigues, a certain percentage of people wanted to work more for various reasons.
References
- Young Adults’ Sleep Duration on Work Days: Differences Between East and West - Scientific Figure on ResearchGate. Available from: [accessed 28 Nov, 2021]. Integer et mi sed ex condimentum tempus, 2010.
- Thttps://trends.google.com/trends/explore?date=all&geo=SG&q=sleep
- Aditi Sharma Kalra ,https://www.humanresourcesonline.net/how-much-sleep-do-singaporeans-get-a-majority-64-manage-6-7-hours-per-night.15 January 2021.
